3.1. How to understand charts?
3.2. Figure anatomy
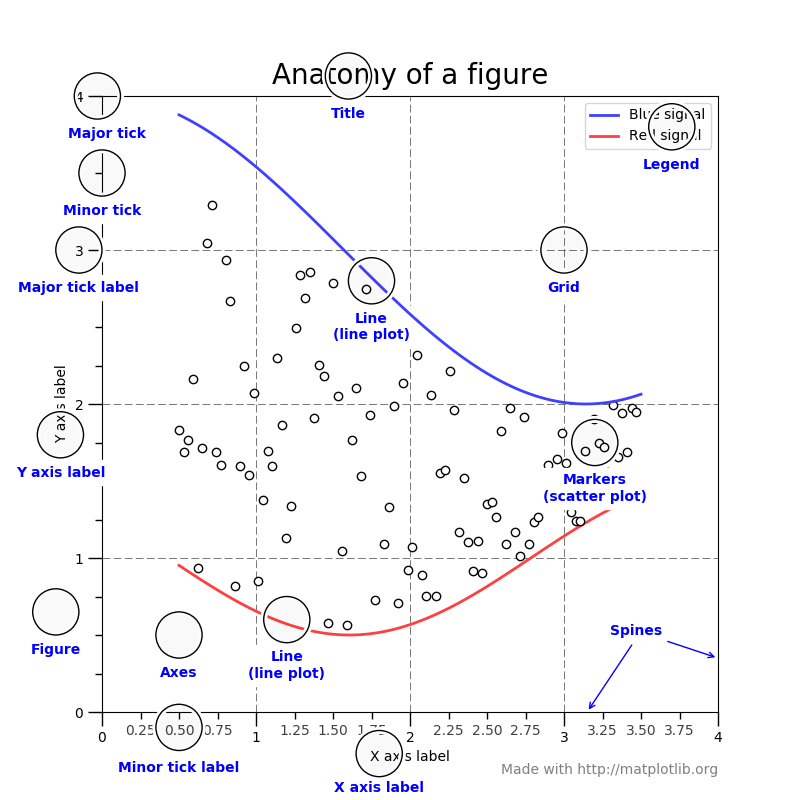
Figure 3.14. Figure Anatomy
3.3. Axes
A given figure can contain many Axes, but a given Axes object can only be in one Figure
Data limits can be controlled via
set_xlim()andset_ylim()methodsEach Axes has a title (set via
set_title()), an x-label (set viaset_xlabel()), and a y-label (set viaset_ylabel())
3.4. Axis
These are the number-line-like objects
Axis can be integers
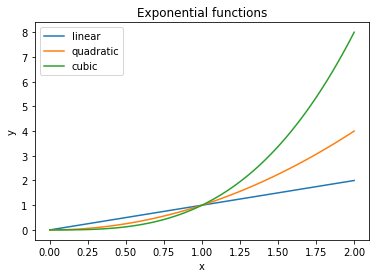
import matplotlib.pyplot as plt
from matplotlib.ticker import MaxNLocator

x = np.linspace(0, 2, 100)

ax = plt.figure().gca()  # ``gca`` - get current axes

ax.plot(x, x, label='linear')
ax.plot(x, x**2, label='quadratic')
ax.plot(x, x**3, label='cubic')

ax.xaxis.set_major_locator(MaxNLocator(integer=True))
3.5. Artist
Everything you can see on the figure is an artist (even the Figure, Axes, and Axis objects)
This includes Text objects, Line2D objects, collection objects, Patch objects, etc
Most Artists are tied to an Axes; such an Artist cannot be shared by multiple Axes, or moved from one to another