4.2. Style Basic
4.2.1. Axis naming
import matplotlib.pyplot as plt


x = [1,2,3]
y = [4,5,6]

plt.xlabel('X axis')
plt.ylabel('Y axis')

plt.plot(x, y)
plt.show()  # doctest: +SKIP
4.2.2. Title
import matplotlib.pyplot as plt


x = [1,2,3]
y = [4,5,6]

plt.title('This is my chart')

plt.plot(x, y)
plt.show()  # doctest: +SKIP
import matplotlib.pyplot as plt


x = [1,2,3]
y = [4,5,6]

plt.title('This is my chart\nSecond line')

plt.plot(x, y)
plt.show()  # doctest: +SKIP
4.2.3. Legend
Good practice: always have labels
import matplotlib.pyplot as plt


x1 = [1,2,3]
y1 = [4,5,6]

x2 = [1,2,3]
y2 = [10,11,12]

plt.plot(x1, y1, label='first line')
plt.plot(x2, y2, label='second line')

plt.legend()
plt.show()  # doctest: +SKIP
4.2.4. Colors
first color name letter (not recommended):
r- redg- greenb- bluec- cyanm- magentay- yellowk- karminw- white
color names (X11/CSS4):
red
green
blue
cyan
magenta
yellow
karmin
white
https://en.wikipedia.org/wiki/X11_color_names#Color_name_chart
hexadecimal code (RGB or RGBA):
#FF0000- red#00FF00- green#0000FF- blue#FF000033- semi-transparent red
tuple (RGB or RGBA):
(0.1, 0.2, 0.5)(0.1, 0.2, 0.5, 0.3)
plt.bar(x1, y1, label='Bars 1', color='blue')
plt.bar(x2, y2, label='Bars 2', color='red')
4.2.5. Line styles
Other line styles https://matplotlib.org/gallery/lines_bars_and_markers/linestyles.html#sphx-glr-gallery-lines-bars-and-markers-linestyles-py
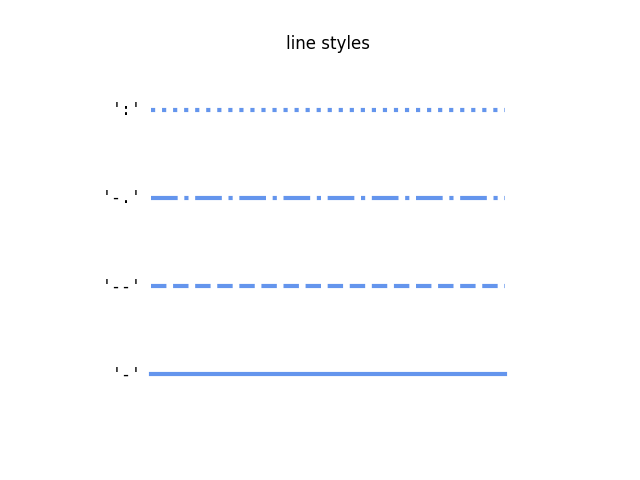
Figure 4.22. Basic line styles
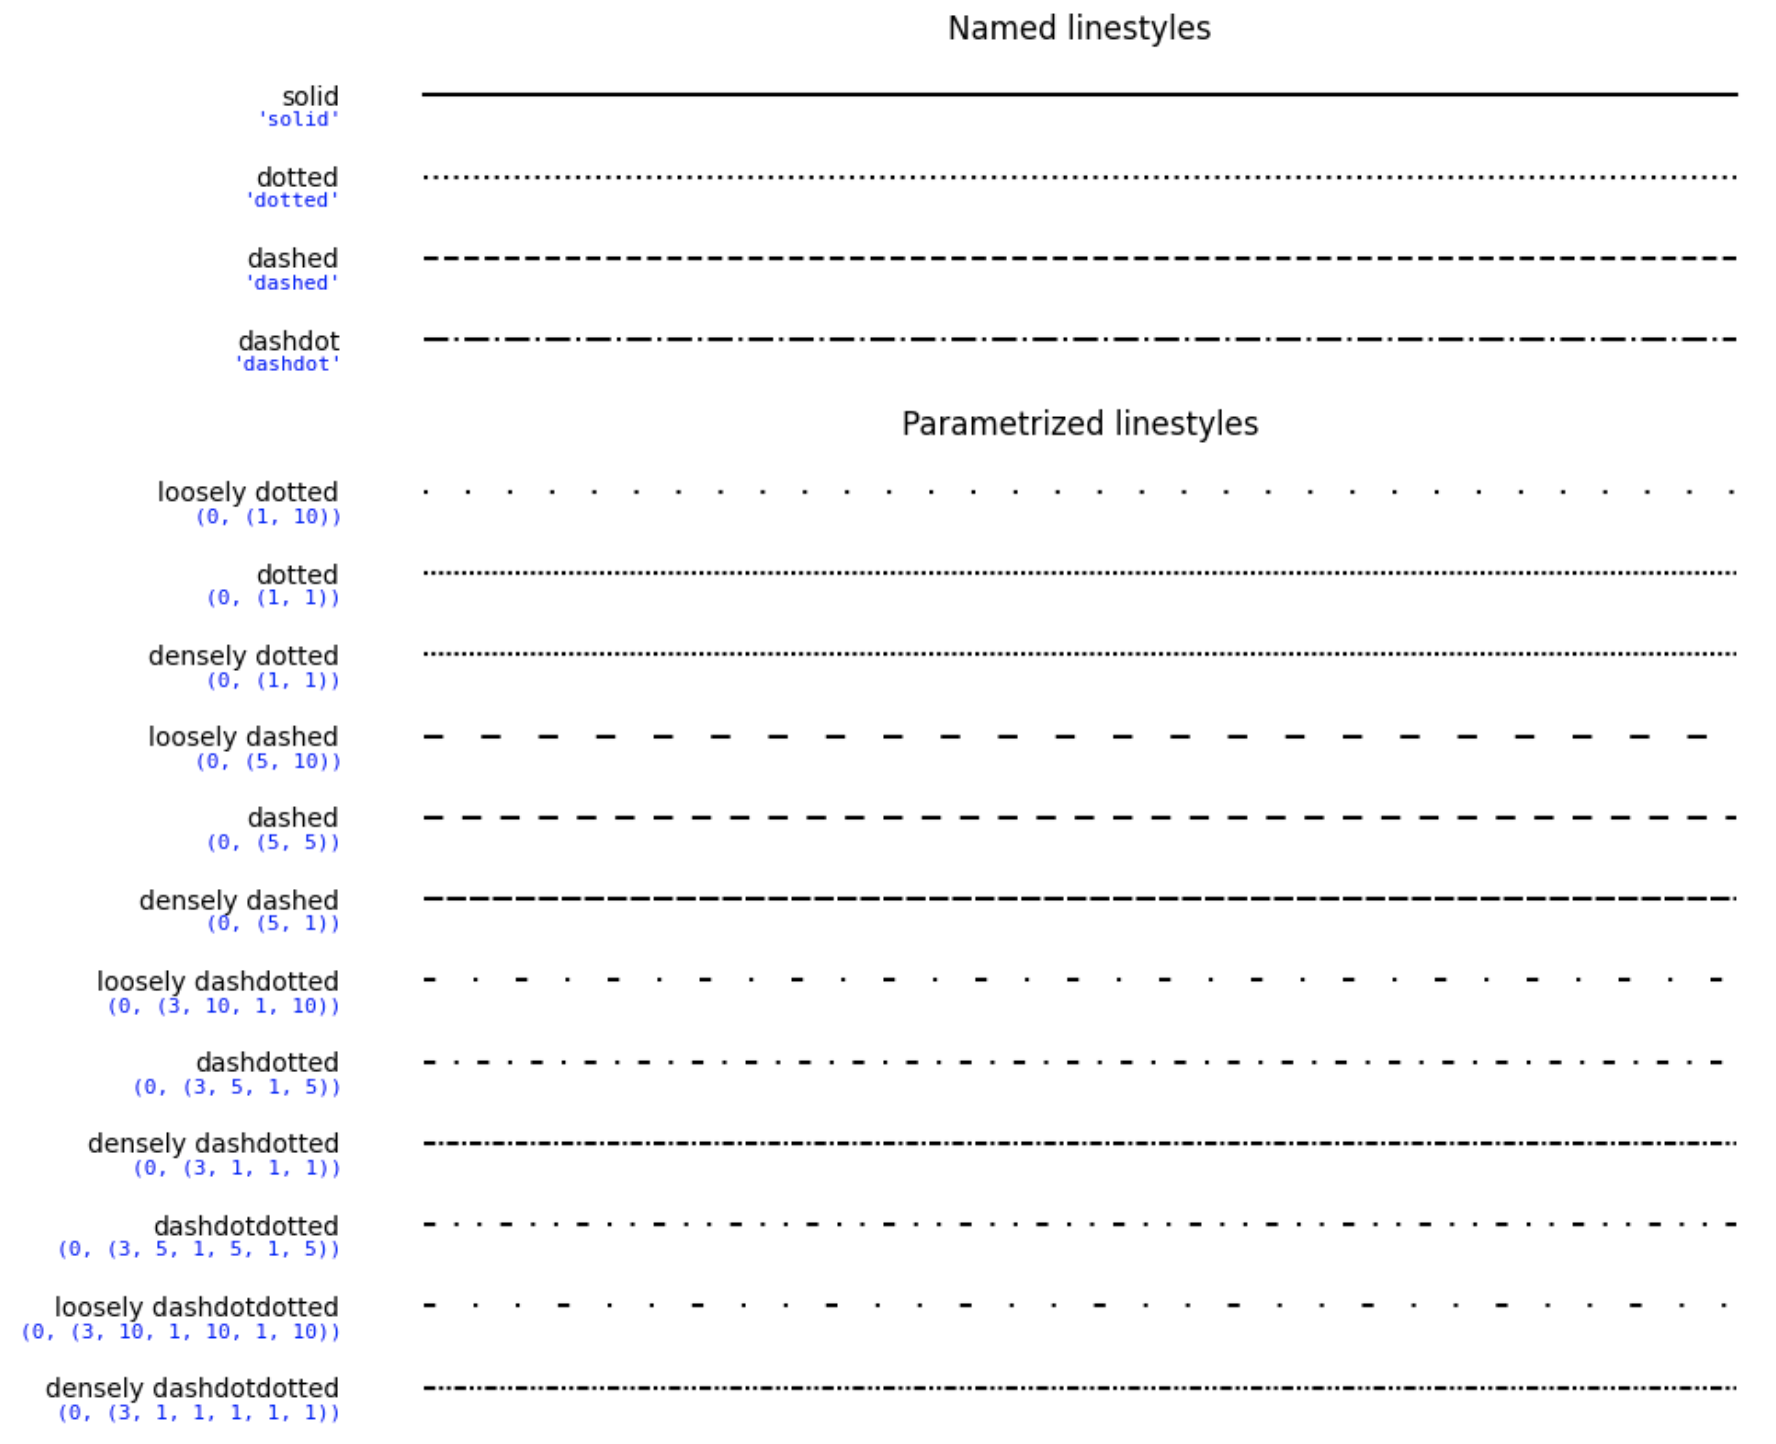
Figure 4.23. Advanced line styles
pylab.plot(x, y, color="red", linestyle='--')
Character |
Description |
|---|---|
|
solid line style |
|
dashed line style |
|
dash-dot line style |
|
dotted line style |
|
point marker |
|
pixel marker |
|
circle marker |
|
triangle_down marker |
|
triangle_up marker |
|
triangle_left marker |
|
triangle_right marker |
|
tri_down marker |
|
tri_up marker |
|
tri_left marker |
|
tri_right marker |
|
square marker |
|
pentagon marker |
|
star marker |
|
hexagon1 marker |
|
hexagon2 marker |
|
plus marker |
|
x marker |
|
diamond marker |
|
thin_diamond marker |
|
vline marker |
|
hline marker |
4.2.6. Line2D parameters
Property |
Value Type |
|---|---|
|
float |
|
[True | False] |
|
[True | False] |
|
a matplotlib.transform.Bbox instance |
|
[True | False] |
|
a Path instance and a Transform instance, a Patch |
|
any matplotlib color |
|
the hit testing function |
|
[ |
|
[ |
|
sequence of on/off ink in points |
|
(np.array xdata, np.array ydata) |
|
a matplotlib.figure.Figure instance |
|
any string |
|
[ |
|
float value in points |
|
[True | False] |
|
[ |
|
any matplotlib color |
|
float value in points |
|
any matplotlib color |
|
float |
|
[ None | integer | (startind, stride) ] |
|
used in interactive line selection |
|
the line pick selection radius |
|
[ |
|
[ |
|
a matplotlib.transforms.Transform instance |
|
[True | False] |
|
np.array |
|
np.array |
|
any number |