5.7. Chart Pie
Display sections in whole group
Automatically calculate percentage
optional features:
slice labels
auto-labeling the percentage
offsetting a slice with "explode"
drop-shadow
custom start angle
5.7.1. Simple Chart
import matplotlib.pyplot as plt


days = [1, 2, 3, 4, 5]

todo        = [4, 3, 3, 2, 0]
in_progress = [6, 6, 5, 5, 2]
in_tests    = [0, 1, 2, 2, 5]
done        = [0, 0, 0, 1, 3]

slices = [7, 2, 2, 13]
status = ['todo', 'in progress', 'working', 'playing']
colors = ['c', 'm', 'r', 'b']

plt.pie(
    x=slices,            # data
    labels=status,       # name of the slices
    colors=colors,       # colors
    startangle=90,       # angle at which start plotting
    shadow=True,         # drop shadow outline?
    explode=[0,1,0,0],   # which piece to explode out from the chart
    autopct='%1.2f%%',   # number formatting
    radius=2,            # size of the chart
)

plt.title('Pie Chart')

plt.show()  # doctest: +SKIP
5.7.2. Donut Pie Chart
fig, ax = plt.subplots()

size = 0.3
vals = np.array([[60., 32.], [37., 40.], [29., 10.]])

cmap = plt.get_cmap("tab20c")
outer_colors = cmap(np.arange(3)*4)
inner_colors = cmap(np.array([1, 2, 5, 6, 9, 10]))

ax.pie(vals.sum(axis=1), radius=1, colors=outer_colors,
       wedgeprops=dict(width=size, edgecolor='w'))

ax.pie(vals.flatten(), radius=1-size, colors=inner_colors,
       wedgeprops=dict(width=size, edgecolor='w'))

ax.set(aspect="equal", title='Pie plot with `ax.pie`')
plt.show()  # doctest: +SKIP
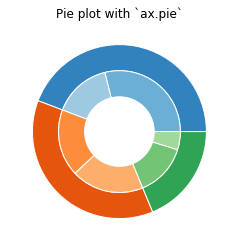
Figure 5.20. Pie chart