5.3. Chart Bar
used to display single values


5.3.1. Syntax
import matplotlib.pyplot as plt


x = [1, 2, 3, 4]
y = [1, 2, 3, 4]

plt.bar(x, y)
plt.show()  # doctest: +SKIP
5.3.2. Single Plot
import matplotlib.pyplot as plt


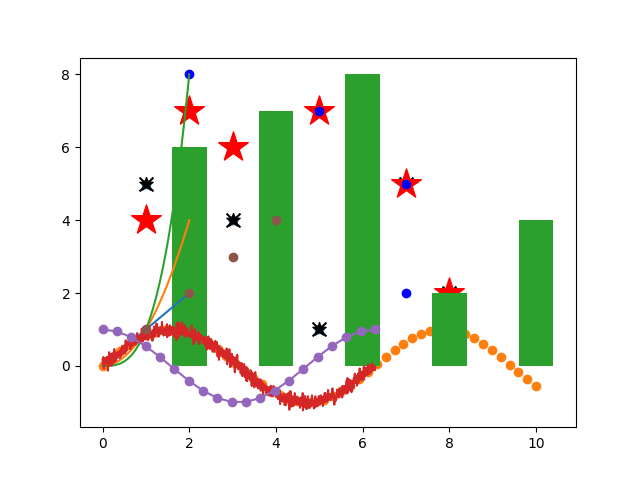
x = [2, 4, 6, 8, 10]
y = [6, 7, 8, 2, 4]

plt.bar(x, y)
plt.show()  # doctest: +SKIP
import matplotlib.pyplot as plt
import numpy as np
np.random.seed(0)


x = np.arange(10)
y = np.random.randint(0, 10, size=10)

plt.bar(x, y)
plt.show()  # doctest: +SKIP
5.3.3. Multiple Plots
import matplotlib.pyplot as plt


x1 = [1, 2, 3, 4]
y1 = [1, 2, 3, 4]

x2 = [0, 2, 5, 6]
y2 = [4, 3, 5, 6]

plt.bar(x1, y1)
plt.bar(x2, y2)
plt.show()  # doctest: +SKIP
import matplotlib.pyplot as plt


bluex = [2, 4, 6, 8, 10]
bluey = [6, 7, 8, 2, 4]
redx = [1, 3, 5, 7, 9]
redy = [7, 8, 2, 4, 2]

plt.bar(x1, y1, color='blue')
plt.bar(x2, y2, color='red')
plt.show()  # doctest: +SKIP