3.3. Figure Style
import matplotlib.pyplot as plt
import numpy as np


x = np.linspace(0, 10, 1000)
y = np.sin(x)

plt.plot(x, y, label='sin(x)')
plt.show()  # doctest: +SKIP
3.3.1. Figure Anatomy
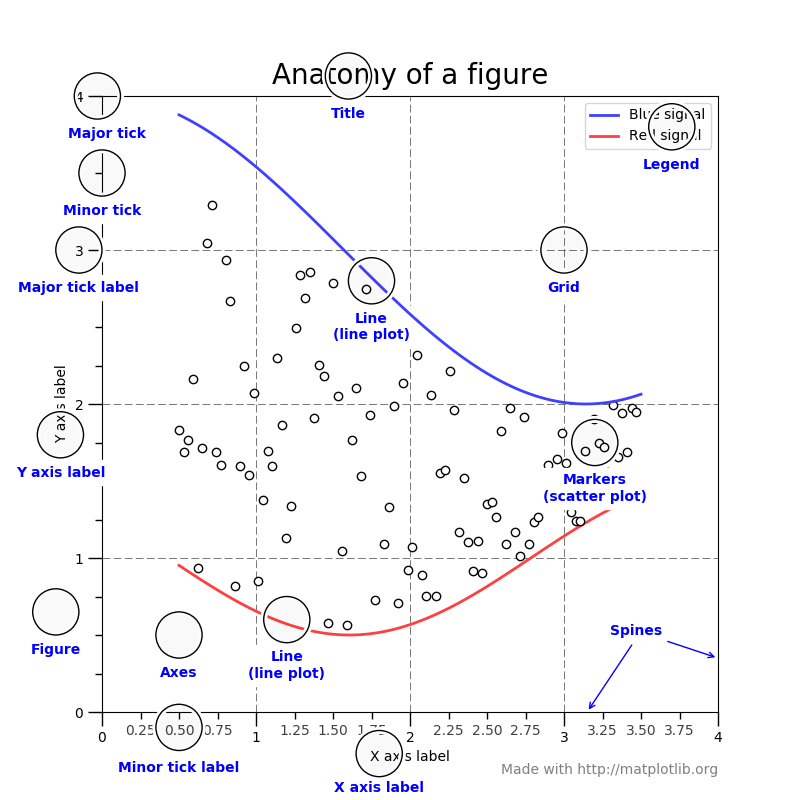
Figure 3.26. Matplotlib Figure Anatomy
3.3.2. Annotations
Title
X Axis Label
Y Axis Label
Text
Annotations
LaTeX
BBox (https://matplotlib.org/devdocs/api/_as_gen/matplotlib.patches.FancyBboxPatch.html)
import matplotlib.pyplot as plt
import numpy as np


x = np.linspace(0, 10, 1000)
y = np.sin(x)

plt.title('Title')
plt.xlabel('X axis')
plt.ylabel('Y axis')

plt.plot(x, y, label='sin(x)')
plt.show()  # doctest: +SKIP
import matplotlib.pyplot as plt
import numpy as np


x = np.linspace(0, 10, 1000)
y = np.sin(x)

plt.text(4.25, 0.5, r'$sin(x)$')

plt.plot(x, y, label='sin(x)')
plt.show()  # doctest: +SKIP
import matplotlib.pyplot as plt
import numpy as np


x = np.linspace(0, 10, 1000)
y = np.sin(x)

plt.annotate('Interesting',
    xy=(1.7, 1.05),                           # Arrow start point
    xytext=(3.0, 1.5),                        # Text start point
    arrowprops={'arrowstyle': '->'},          # Arrow styling
    bbox={'boxstyle': 'round', 'facecolor': '#eeeeee'})  # Text box styling

plt.plot(x, y, label='sin(x)')
plt.show()  # doctest: +SKIP
3.3.3. Axis Limits
import matplotlib.pyplot as plt
import numpy as np


x = np.linspace(0, 10, 1000)
y = np.sin(x)

plt.xlim(-0.0, 10.0)
plt.ylim(-2.0, 2.0)

plt.plot(x, y, label='sin(x)')
plt.show()  # doctest: +SKIP
3.3.4. Legend
location
import matplotlib.pyplot as plt
import numpy as np


x = np.linspace(0, 10, 1000)
y = np.sin(x)

plt.plot(x, y, label='sin(x)')
plt.legend(loc='upper right')
plt.show()  # doctest: +SKIP
import matplotlib.pyplot as plt
import numpy as np


x = np.linspace(0, 10, 1000)
y = np.sin(x)

plt.plot(x, y, label='sin(x)')
plt.legend(loc='best')
plt.show()  # doctest: +SKIP
3.3.5. Ticks
Minor
Major
Rotation
import matplotlib.pyplot as plt
import numpy as np


x = np.linspace(0, 10, 1000)
y = np.sin(x)

plt.yticks(rotation=0)
plt.xticks(rotation=45)

plt.plot(x, y, label='sin(x)')
plt.show()  # doctest: +SKIP
import matplotlib.pyplot as plt


x = [1, 2, 3, 4, 5]
y = [1, 4, 9, 6, 8]
labels = ['Monday', 'Tuesday', 'Wednesday', 'Thursday', 'Friday']

plt.xticks(x, labels, rotation='vertical')
plt.plot(x, y, marker='o')
plt.show()  # doctest: +SKIP
import matplotlib.pyplot as plt
import numpy as np


x = np.linspace(0, 10, 1000)
y = np.sin(x)

plt.xticks(
    ticks = np.arange(0, 10, np.pi),
    labels = [0, '$\pi$', '$2\pi$', '$3\pi$'],
    color = 'red')

plt.plot(x, y, label='sin(x)')
plt.show()  # doctest: +SKIP
import matplotlib.pyplot as plt
import numpy as np


x = np.linspace(0, 10, 1000)
y = np.sin(x)

plt.xticks(
    ticks = np.arange(0, 10, np.pi),
    labels = [0, '$\pi$', '$2\pi$', '$3\pi$'])

plt.tick_params(
    top=False,
    bottom=False,
    left=False,
    right=False,
    labelleft=False,
    labelbottom=True)

plt.plot(x, y, label='sin(x)')
plt.show()  # doctest: +SKIP
import matplotlib.pyplot as plt
import numpy as np


x = np.linspace(0, 10, 1000)
y = np.sin(x)
labels = [0, '$\pi$', '$2\pi$', '$3\pi$']
major_ticks = np.arange(0, 10, np.pi)
minor_ticks = np.arange(0, 10, 1)

ax = plt.gca() # get current axes
ax.set_xticks(major_ticks)
ax.set_xticks(minor_ticks, minor=True)
ax.set_xticklabels(labels)
ax.set_yticks(major_ticks)
ax.set_yticks(minor_ticks, minor=True)
ax.tick_params(which='major', width=2, length=8, color='red')
ax.tick_params(which='minor', width=0.5, length=4, color='#00000088')
ax.set_xlim(-0.0, 10.0)
ax.set_ylim(-2, 2)

plt.plot(x, y, label='sin(x)')
plt.show()  # doctest: +SKIP
3.3.6. Spines
import matplotlib.pyplot as plt
import numpy as np


x = np.linspace(0, 10, 1000)
y = np.sin(x)

ax = plt.gca()
ax.spines['right'].set_visible(False)
ax.spines['top'].set_visible(False)
ax.spines['bottom'].set_visible(False)
ax.spines['left'].set_visible(False)

plt.plot(x, y, label='sin(x)')
plt.show()  # doctest: +SKIP
import matplotlib.pyplot as plt
import numpy as np


x = np.linspace(0, 10, 1000)
y = np.sin(x)

ax = plt.gca()
ax.spines['right'].set_visible(False)
ax.spines['top'].set_visible(False)
ax.spines['bottom'].set_visible(False)
ax.spines['left'].set_visible(False)

plt.tick_params(
    top=False,
    bottom=False,
    left=False,
    right=False,
    labelleft=True,
    labelbottom=True)

plt.plot(x, y, label='sin(x)')
plt.show()  # doctest: +SKIP
3.3.7. Grid
import matplotlib.pyplot as plt
import numpy as np


x = np.linspace(0, 10, 1000)
y = np.sin(x)

plt.grid(True)

plt.plot(x, y, label='sin(x)')
plt.show()  # doctest: +SKIP
import matplotlib.pyplot as plt
import numpy as np


x = np.linspace(0, 10, 1000)
y = np.sin(x)

plt.grid(alpha=0.2)

plt.plot(x, y, label='sin(x)')
plt.show()  # doctest: +SKIP
import matplotlib.pyplot as plt
import numpy as np


x = np.linspace(0, 10, 1000)
y = np.sin(x)
major_ticks = np.arange(0, 10, np.pi)
minor_ticks = np.arange(0, 10, 1)

ax = plt.gca()  # get current axes
ax.set_xticks(major_ticks)
ax.set_xticks(minor_ticks, minor=True)
ax.set_xticklabels([0, '$\pi$', '$2\pi$', '$3\pi$'])
ax.set_yticks(major_ticks)
ax.set_yticks(minor_ticks, minor=True)
ax.tick_params(which='major', width=2, length=8, color='red')
ax.tick_params(which='minor', width=0.5, length=4, color='#00000088')
ax.set_xlim(-0.0, 10.0)
ax.set_ylim(-2, 2)
ax.grid(which='minor', alpha=0.2)
ax.grid(which='major', alpha=0.8, color='red')

plt.plot(x, y, label='sin(x)')
plt.show()  # doctest: +SKIP
3.3.8. Trend Line
import matplotlib.pyplot as plt
import numpy as np


x = [1, 3, 5, 7, 9]
y = [2, 3, 4, 3, 4]

# calculate the trendline
model = np.polyfit(x, y, 1)
trend = np.poly1d(model)

plt.plot(x, y, label='data')
plt.plot(x, trend(x), color='red', linestyle='--', label='trend')
plt.show()  # doctest: +SKIP
import matplotlib.pyplot as plt
import numpy as np


x = np.linspace(0, 10, 1000)
y = np.sin(x)

model = np.polyfit(x, y, 5)
trend = np.poly1d(model)

plt.plot(x, y, label='sin(x)')
plt.plot(x, trend(x), color='red', linestyle='--', label='trend')
plt.show()  # doctest: +SKIP
3.3.9. Styles
import matplotlib.pyplot as plt


print(plt.style.available)
# ['Solarize_Light2', '_classic_test_patch', 'bmh', 'classic', 'dark_background', 'fast', 'fivethirtyeight',
#  'ggplot', 'grayscale', 'seaborn', 'seaborn-bright', 'seaborn-colorblind', 'seaborn-dark',
#  'seaborn-dark-palette', 'seaborn-darkgrid', 'seaborn-deep', 'seaborn-muted', 'seaborn-notebook',
#  'seaborn-paper', 'seaborn-pastel', 'seaborn-poster', 'seaborn-talk', 'seaborn-ticks', 'seaborn-white',
#  'seaborn-whitegrid', 'tableau-colorblind10']
import matplotlib.pyplot as plt


x = np.linspace(0, 10, 1000)
y = np.sin(x)

plt.style.use('fivethirtyeight')

plt.plot(x, y, label='sin(x)')
plt.show()  # doctest: +SKIP