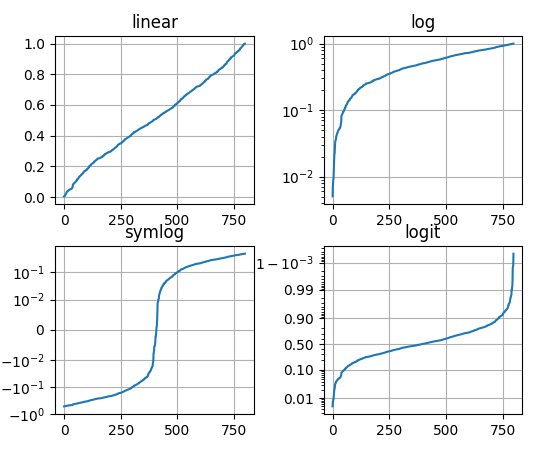
3.4. Figure Scales
Linear
Logarithmic
Symmetrical log (partially linear
linthreshx: int)Logit - reversed logarithmic
Subtracting
x.mean()is used to better highlight the function
3.4.1. Linear Scale
import matplotlib.pyplot as plt
import numpy as np


x = np.linspace(0, 10, 1000)
y = x - x.mean()

plt.yscale('linear')

plt.plot(x, y)
plt.show()  # doctest: +SKIP
3.4.2. Logarithmic Scale
import matplotlib.pyplot as plt
import numpy as np


x = np.linspace(0, 10, 1000)
y = x - x.mean()

plt.yscale('log')

plt.plot(x, y)
plt.show()  # doctest: +SKIP
3.4.3. Symmetrical Logarithmic Scale
import matplotlib.pyplot as plt
import numpy as np


x = np.linspace(0, 10, 1000)
y = x - x.mean()

plt.yscale('symlog', linthresh=0.01)

plt.plot(x, y)
plt.show()  # doctest: +SKIP
3.4.4. Logit Scale
import matplotlib.pyplot as plt
import numpy as np


x = np.linspace(0, 10, 1000)
y = x - x.mean()

plt.yscale('logit')

plt.plot(x, y)
plt.show()  # doctest: +SKIP